Gravitational Wave Hackathon
g2net hackathon in Malta (2020) and Thessaloniki (2023)
Cover Image by LIGO Caltech
I have had the pleasure to participate in two hackathons related to gravitational waves as part of the workshops organized by the network for Gravitational Waves, Geophysics and Machine Learning (G2Net). The first one was in Malta in 2020 where I participated in person and the second one was in Thessaloniki in 2023 where I participated remotely. The hackathons were a great opportunity to learn more about the field of gravitational waves and machine learning, and to meet other researchers in the field.
Malta 2020
The data used for the challenge contains earthquake from all over the world, together with noise (non-earthquake ambient noise). Earthquakes are very similar to gravitational waves, and in this context, have no meaningful difference. The goal of this challenge is to correctly classify an unknown set of data using any model that was trained on a provided dataset where the correct labels are provided. The full dataset is available on Kaggle
For each of the samples in the dataset, there is a number of features that describe the data. The main features are the E, N, and Z components of the data, which are the three components of the seismic wave. Each component contains 6000 samples. There are other features that describe the location of the receiver and the source, the arrival times of the P and S waves, and the signal-to-noise ratio of the three components. Each element is labeled as one of the following classes:
-
0: Noise -
1: Near_Small -
2: Near_Medium -
3: Near_Large -
4: Far_Small -
5: Far_Medium -
6: Far_Large
I used two different approaches to classify the data: an ensemble method and a convolutional neural network (CNN). The ensemble method is based on the AdaBoost algorithm, which combines multiple weak classifiers to create a strong classifier. The CNN is a deep learning model that is able to learn features from the data and classify it accordingly.
For the optimization of the CNN model, I used the Optuna library to search for the best hyperparameters. The hyperparameters that were optimized include the learning rate, dropout rate, regularization rate, and the batch size. For the training, I used 50 epochs with early stopping based on the validation loss. The model was trained on the training data and validated on the validation data. The loss and accuracy of the training and validation data were monitored during the training process and shown in the plots below.

The results of the challenge were evaluated based on the accuracy of the predictions. The CNN model greatly outperformed the AdaBoost model, which was not able to achieve a high accuracy. The results of the CNN model are shown in the table below:
| Metric | Score |
|---|---|
| Precision | 79.5% |
| Recall | 79.6% |
| F1-score | 79.5% |
| Balanced accuracy | 79.6% |
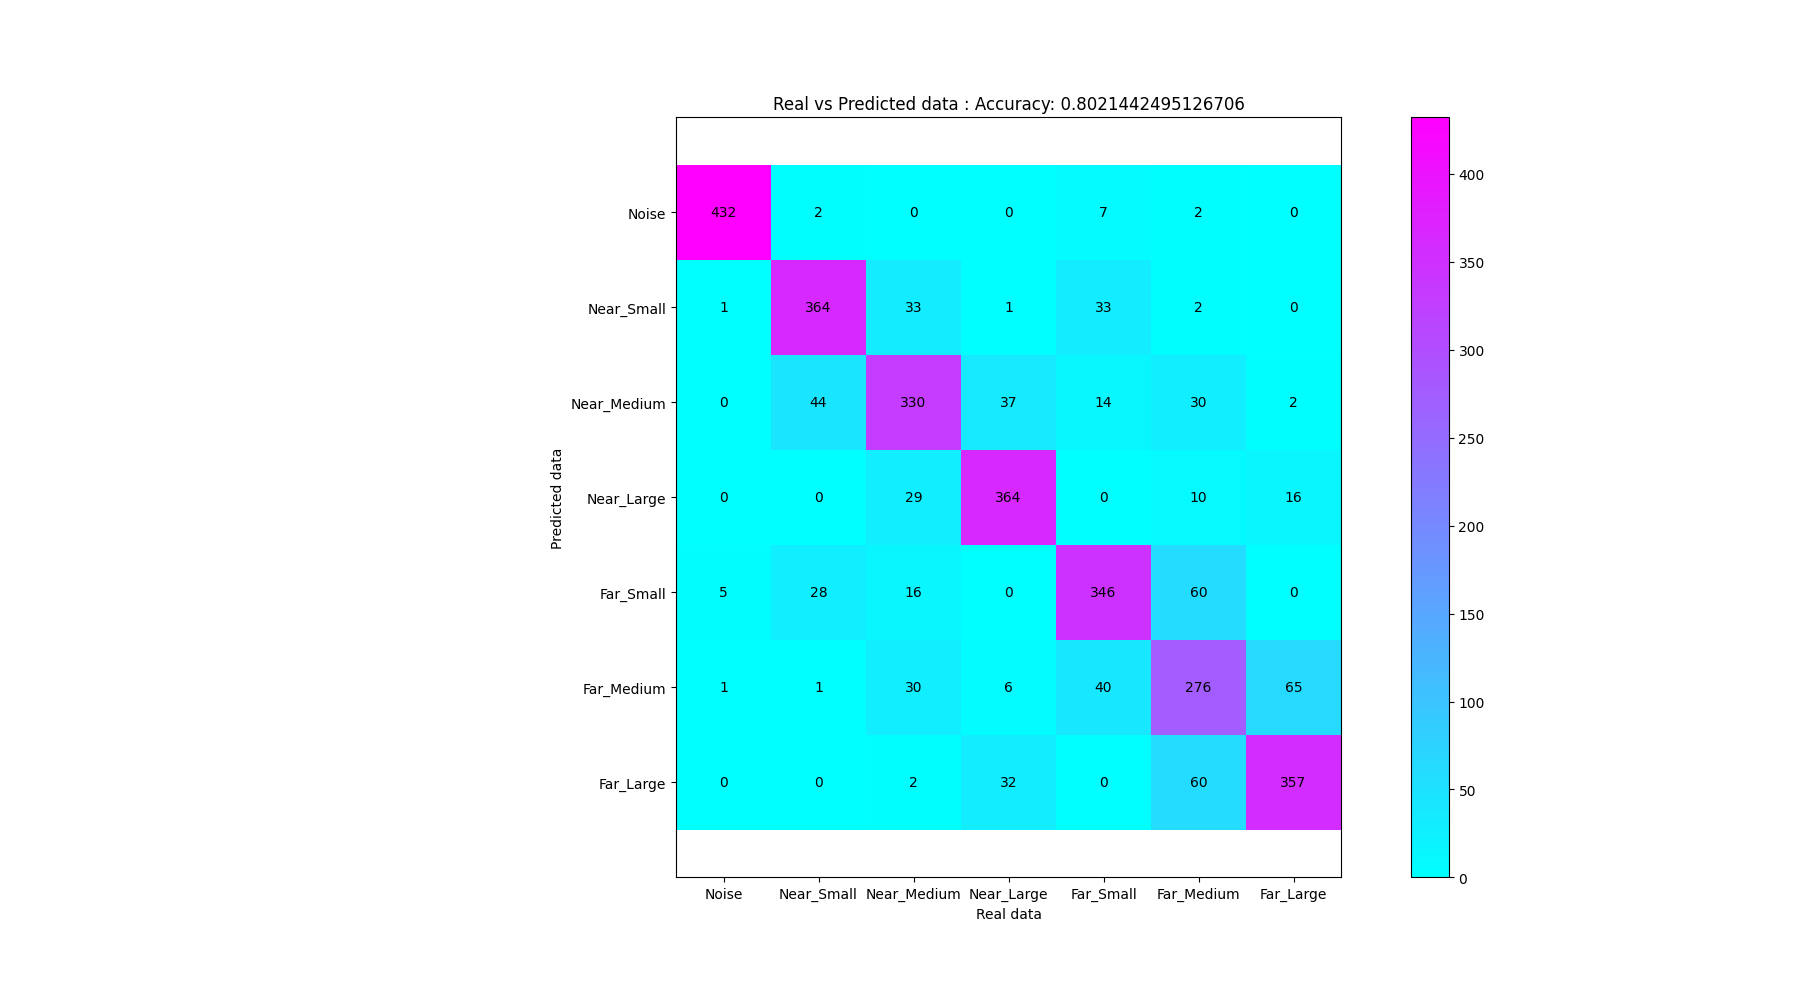
For better understanding of the results, the confusion matrix is shown below:

Overall, the hackathon in Malta was a great experience and I learned a lot about the field of gravitational waves and machine learning. It was one of my first experiences with deep learning and looking back (especially on the code), I see how much I have learned since then. For the full code of the project and instructions on how to run it, please visit the GitHub repository of the project.
Thessaloniki 2023
The hackathon in Thessaloniki was a great opportunity to participate in a similar challenge and learn more about the field of gravitational waves and machine learning. The challenge was to classify noise segments of the Hanford detector during the O3 run into one of three categories based on the signal-to-noise ratio (SNR). The full dataset is available on Kaggle
Each sample in the dataset consists of a single time series of 2048 data points. The three categories used for the classification are:
-
0: 0 <= SNR < 6 -
1: 6 <= SNR < 10 -
2: SNR >= 10
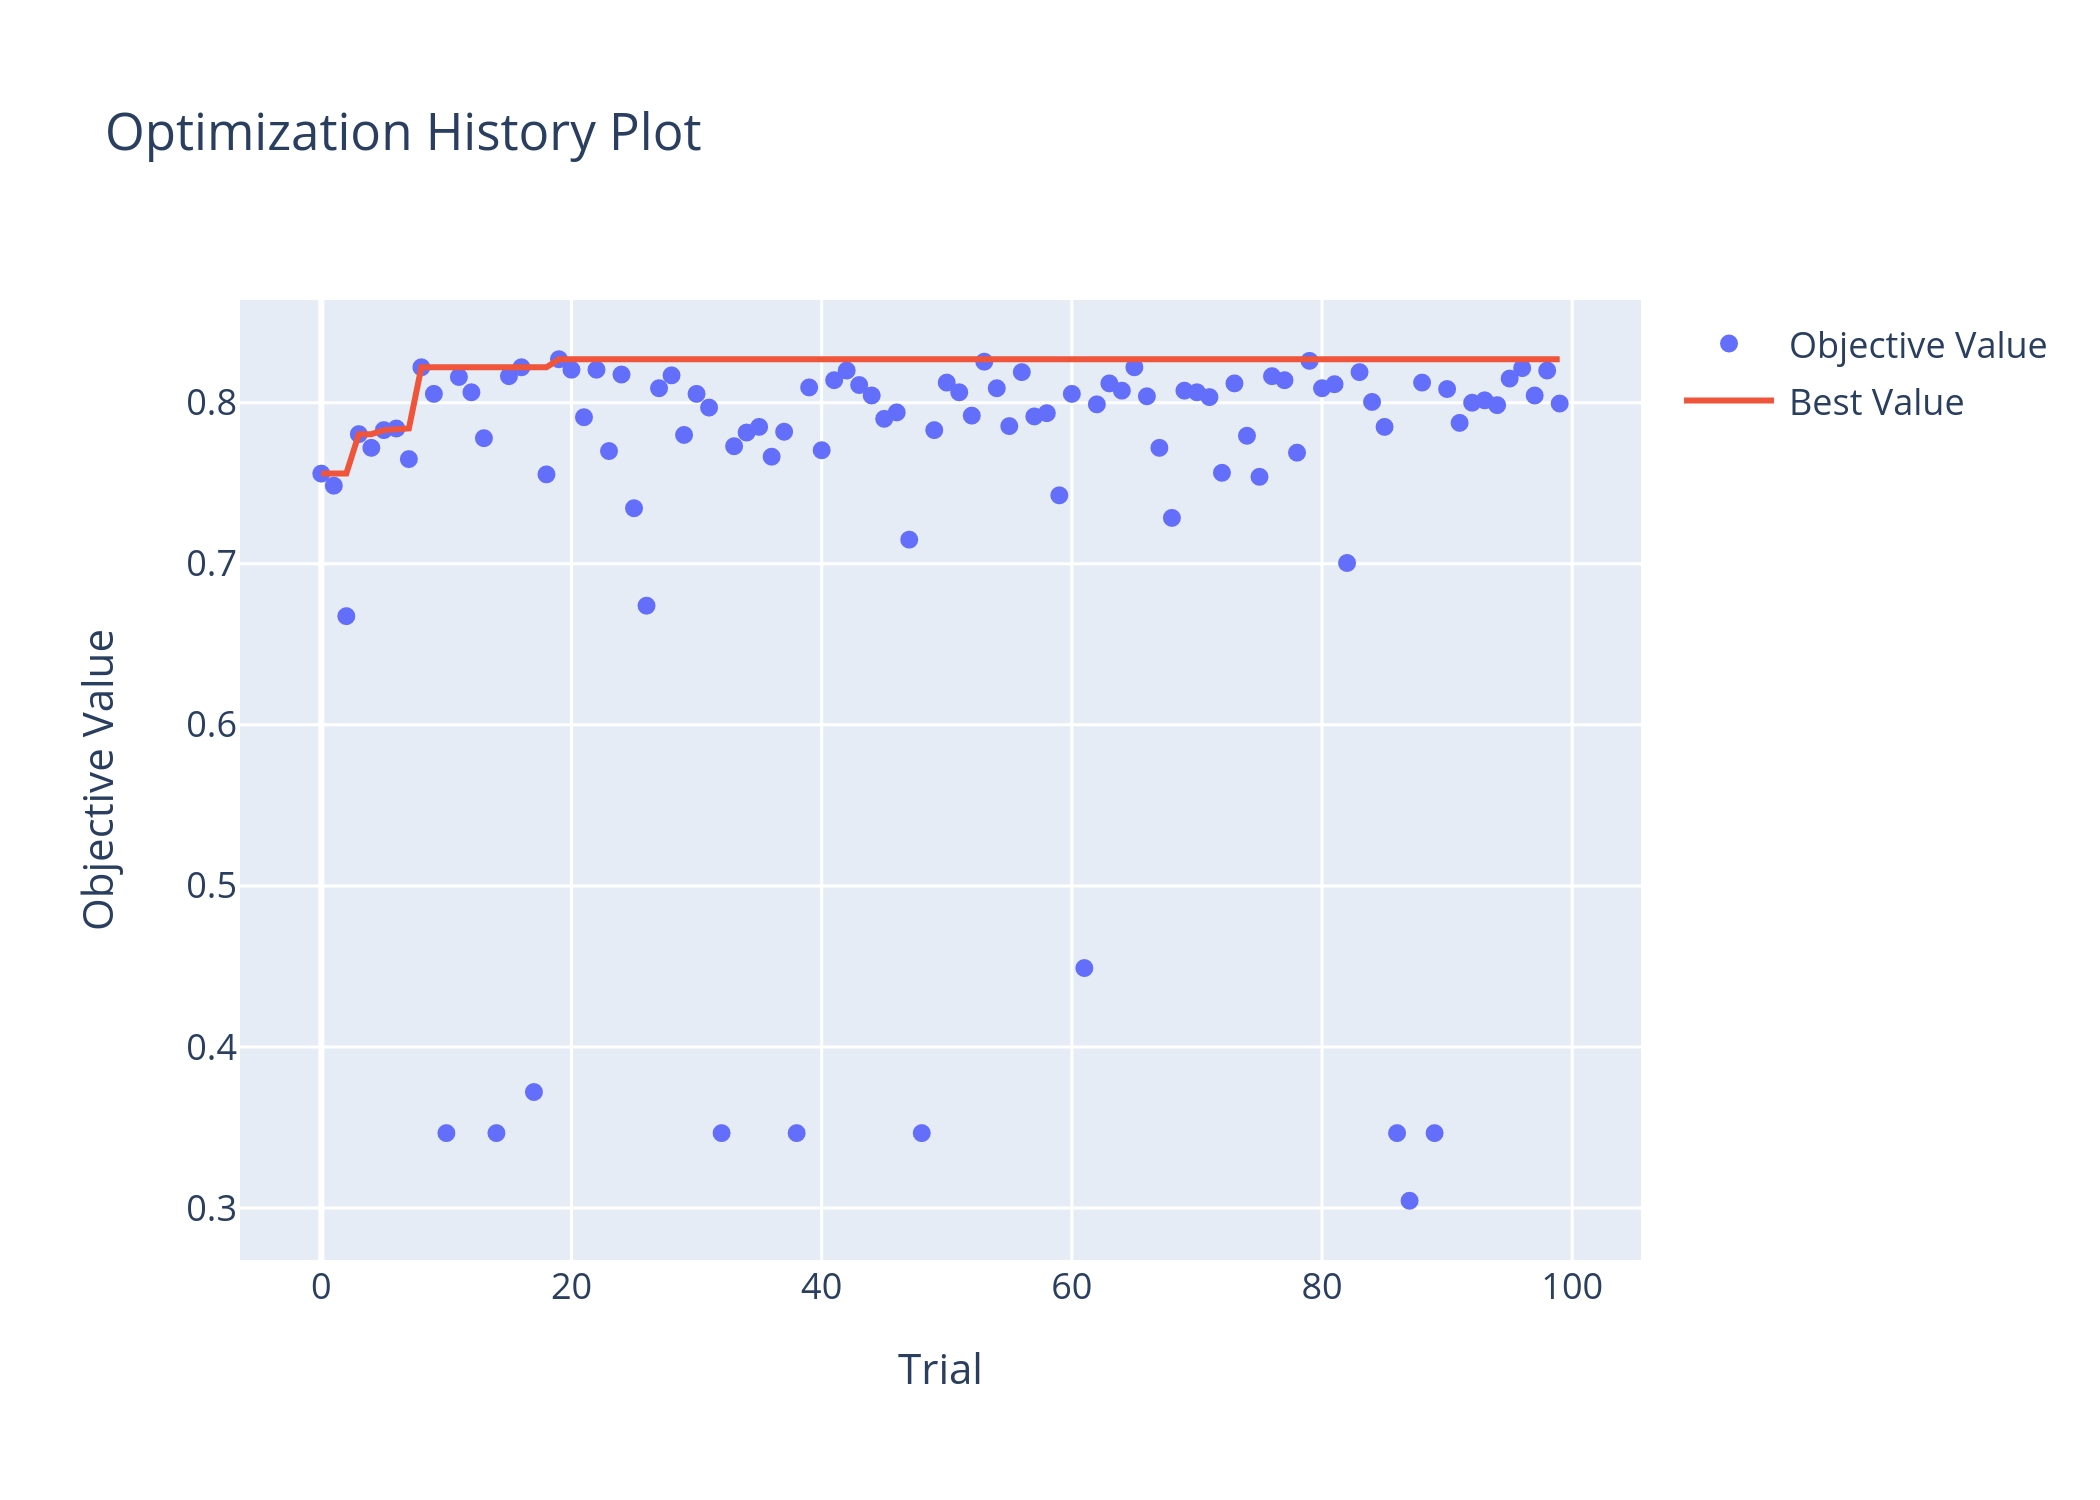
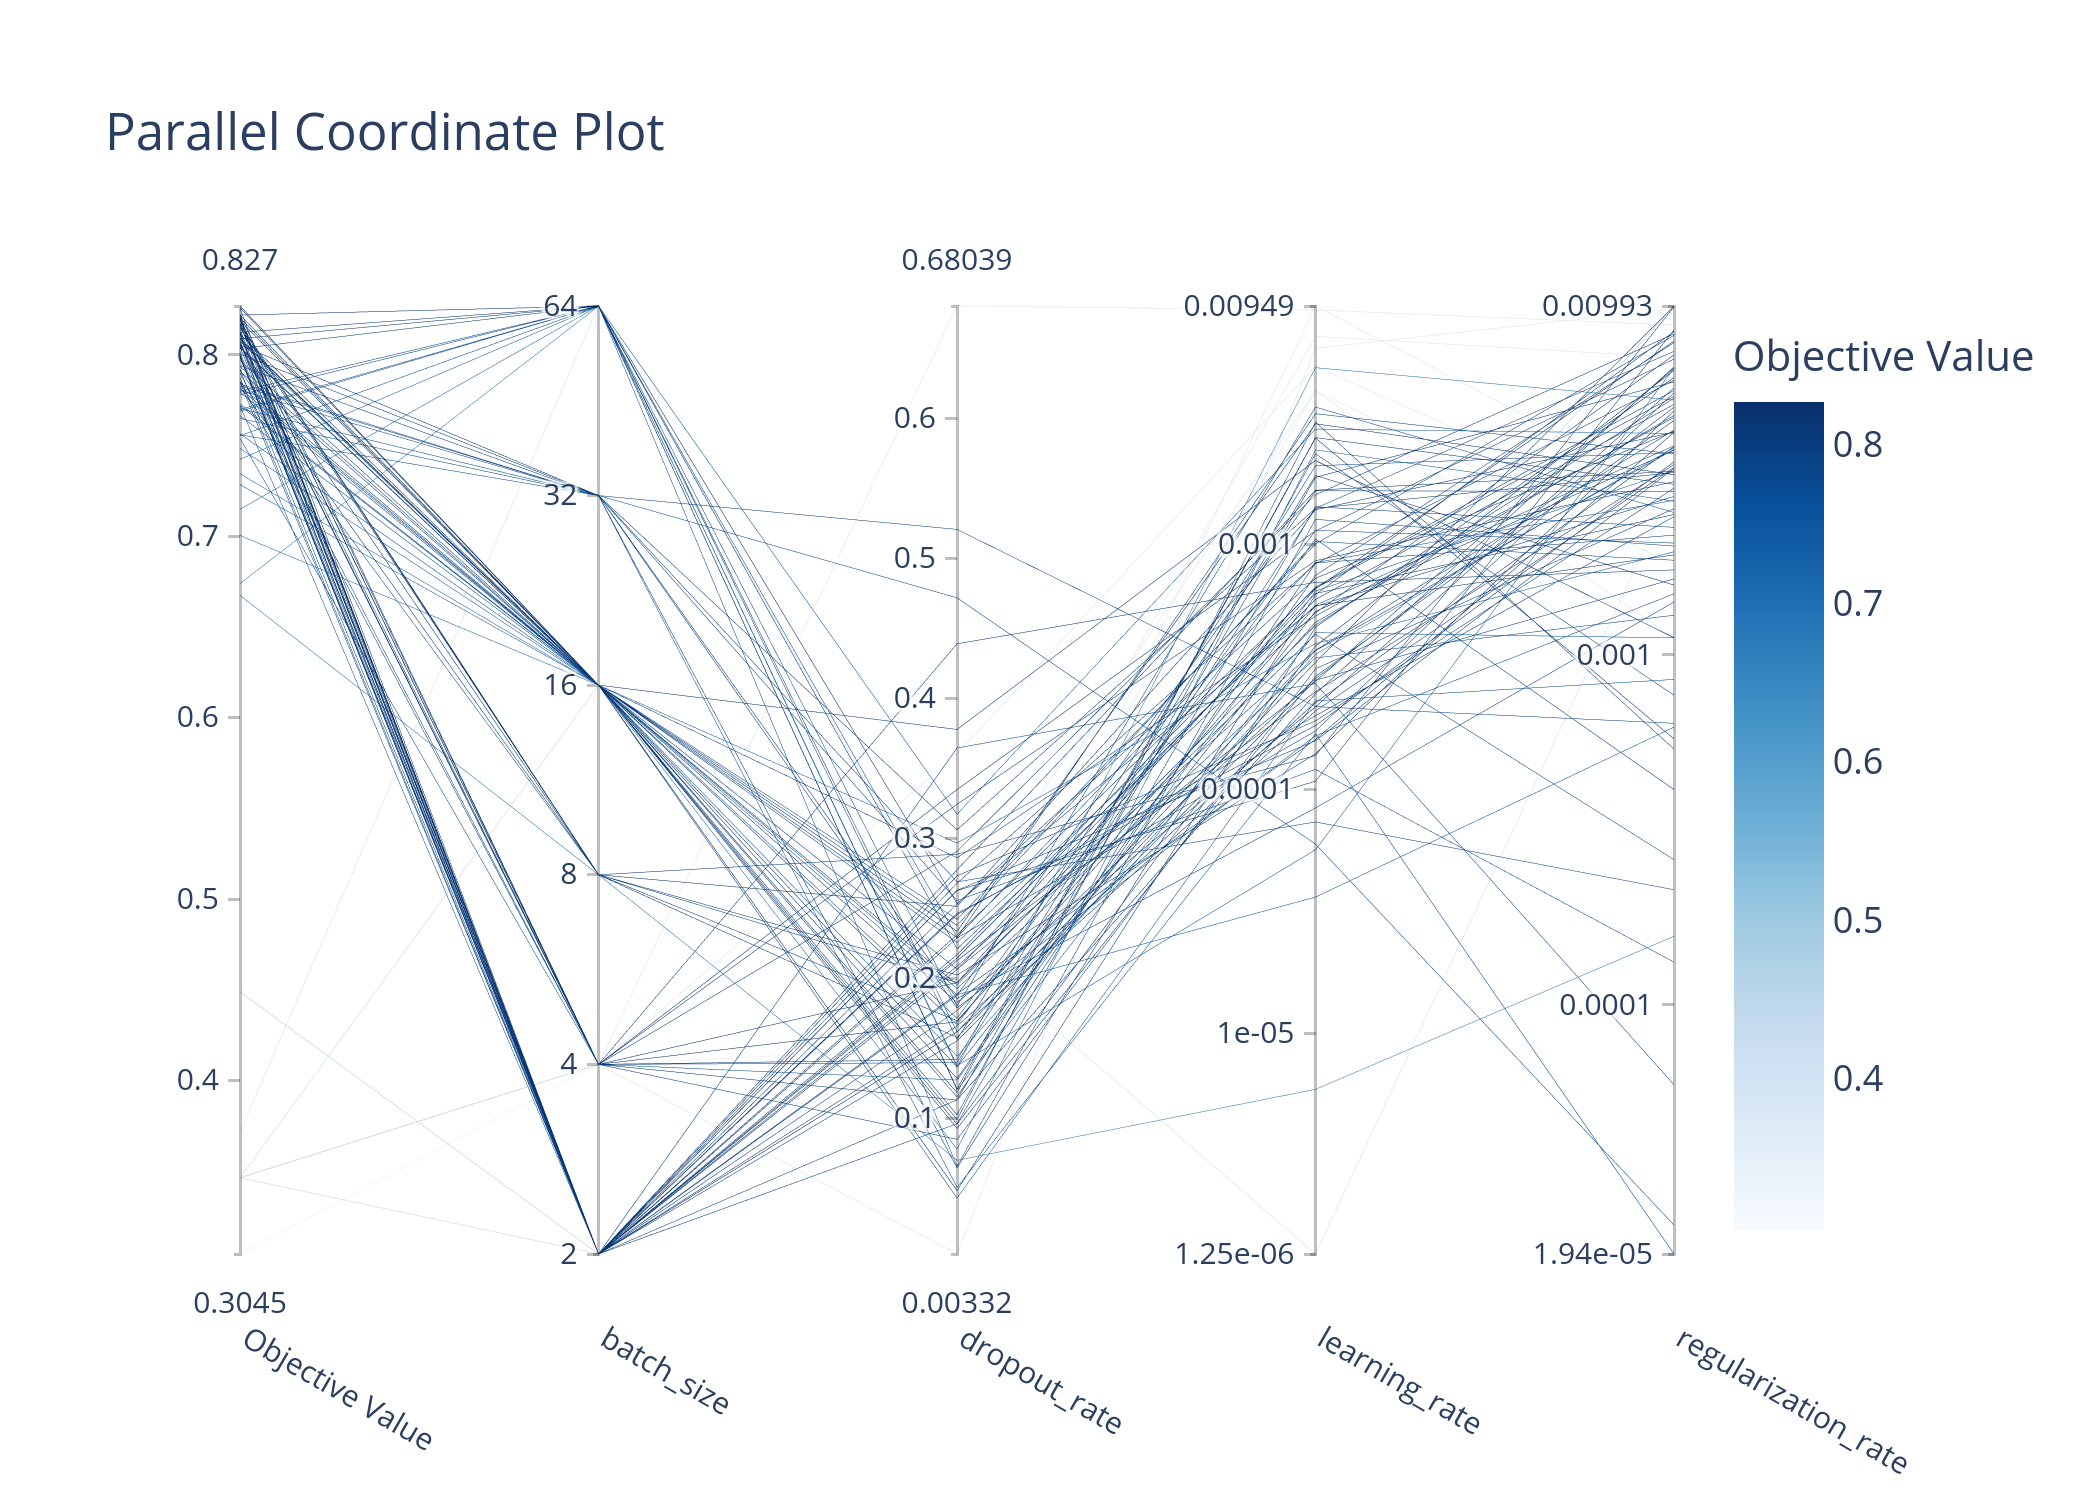
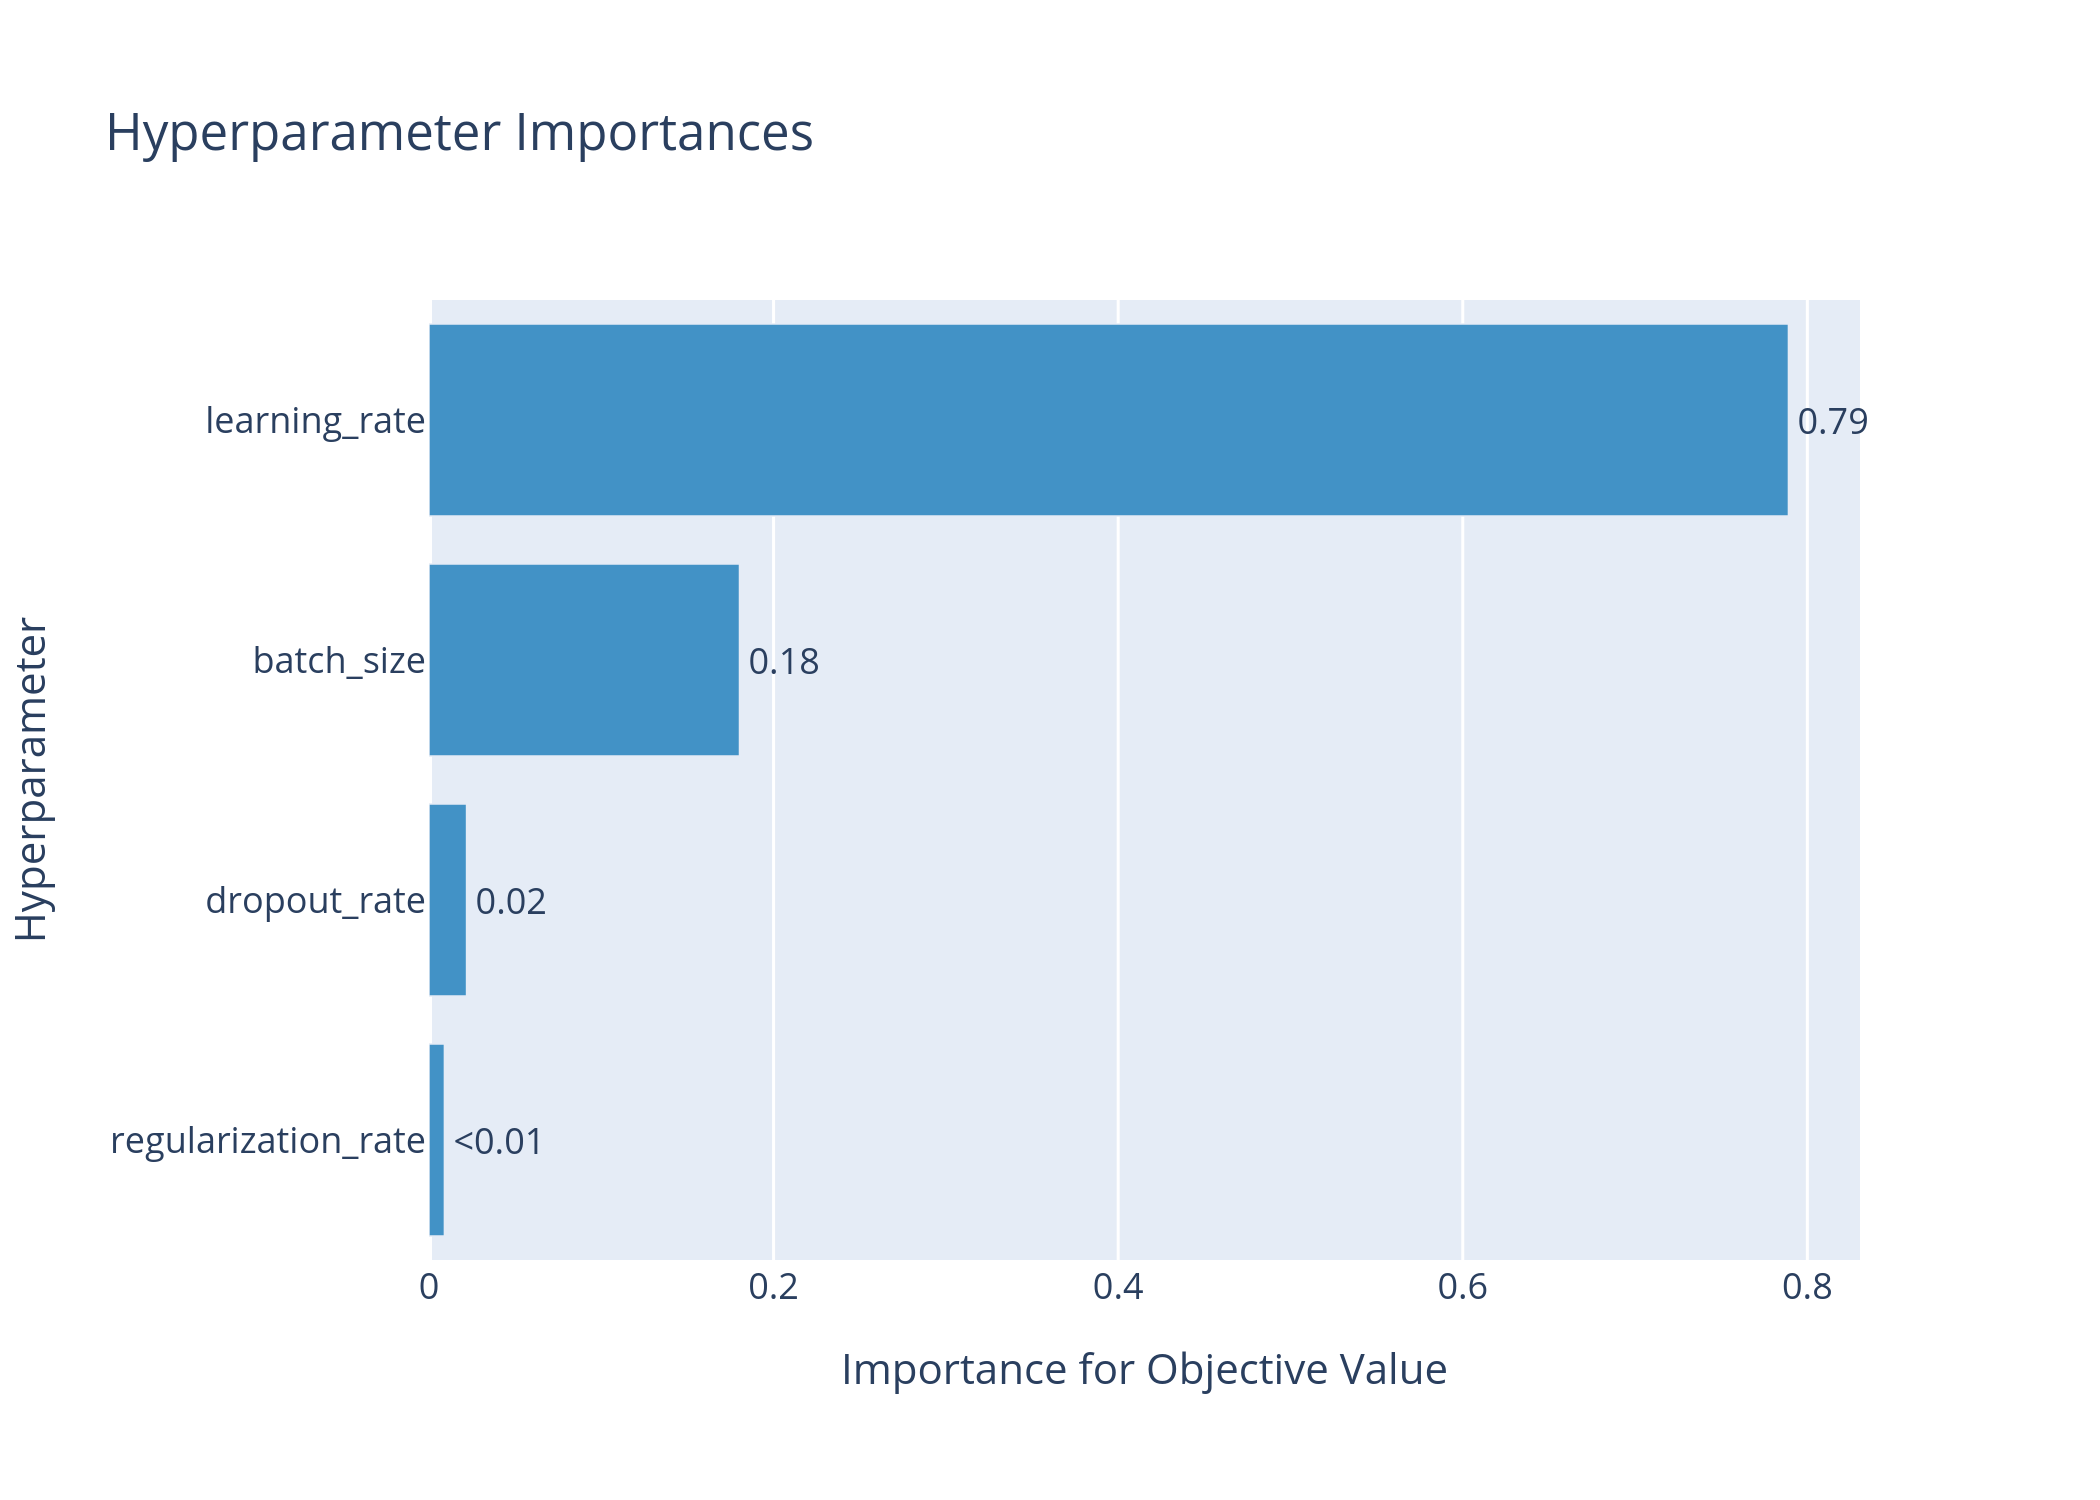
For the model, I used a convolutional neural network (CNN) with Optuna for hyperparameter optimization. During optimization, the learning rate, dropout rate, regularization rate, and batch size were searched for the best values. Some useful plots for the optimization process are shown below.


The results of the challenge were evaluated based on the accuracy of the predictions. The submission was done on the Kaggle platform and the results are shown in the table below:
| Dataset | Accuracy |
|---|---|
| Training | 87.53% |
| Validation | 82.35% |
| Test | 83.91% |

I believe that the hackathon in Thessaloniki has shown to me how much I have learned since the previous hackathon in Malta. I was able to achieve better results and understand the process more thoroughly. Even though the time I was able to dedicate to the project was limited, I was able to achieve results that would place me in the top 3 of the competition, if not for the late submission. For the full code of the project and instructions on how to run it, please visit the GitHub repository of the project.
[Header image taken from LIGO Caltech website.]