Finding the best exoplanets to search for exomoons by radial velocity
Master's thesis research project (1st year)
Cover Image by NASA showing a natural color view of Titan and Saturn from NASA Cassini spacecraft.
Please find the thesis here. The code of the project is not available yet, but will be soon. Stay tuned!
Overview
This research delves into the detection of exomoons through radial velocity variations, focusing on the exoplanet β Pictoris b. Exomoons are natural satellites orbiting planets outside our solar system and may provide critical insights into planetary system formation and habitability. The study combines theoretical modeling, simulation, and real observational data to refine detection techniques and explore new frontiers in exoplanetary science.
Introduction
The discovery of exoplanets has profoundly transformed our understanding of the universe, uncovering a wealth of planetary systems that showcase the diversity and complexity of planetary formation and evolution. Since the first confirmed detection in the early 1990s, thousands of exoplanets have been identified, with techniques such as radial velocity and transit photometry playing central roles in these groundbreaking discoveries. These methods have provided invaluable insights into the masses, sizes, and orbits of these distant worlds, setting the foundation for a deeper understanding of planetary systems.
Despite this remarkable progress, the detection of exomoons—natural satellites orbiting planets outside our solar system—remains an elusive goal. Unlike their host planets, exomoons are typically smaller and generate weaker observational signals, making their detection a formidable challenge. Yet, exomoons hold immense scientific potential: they can offer clues about the processes of planetary formation, the dynamical evolution of systems, and even the conditions for habitability. The ability to detect and study exomoons would thus mark a major milestone in exoplanetary science.
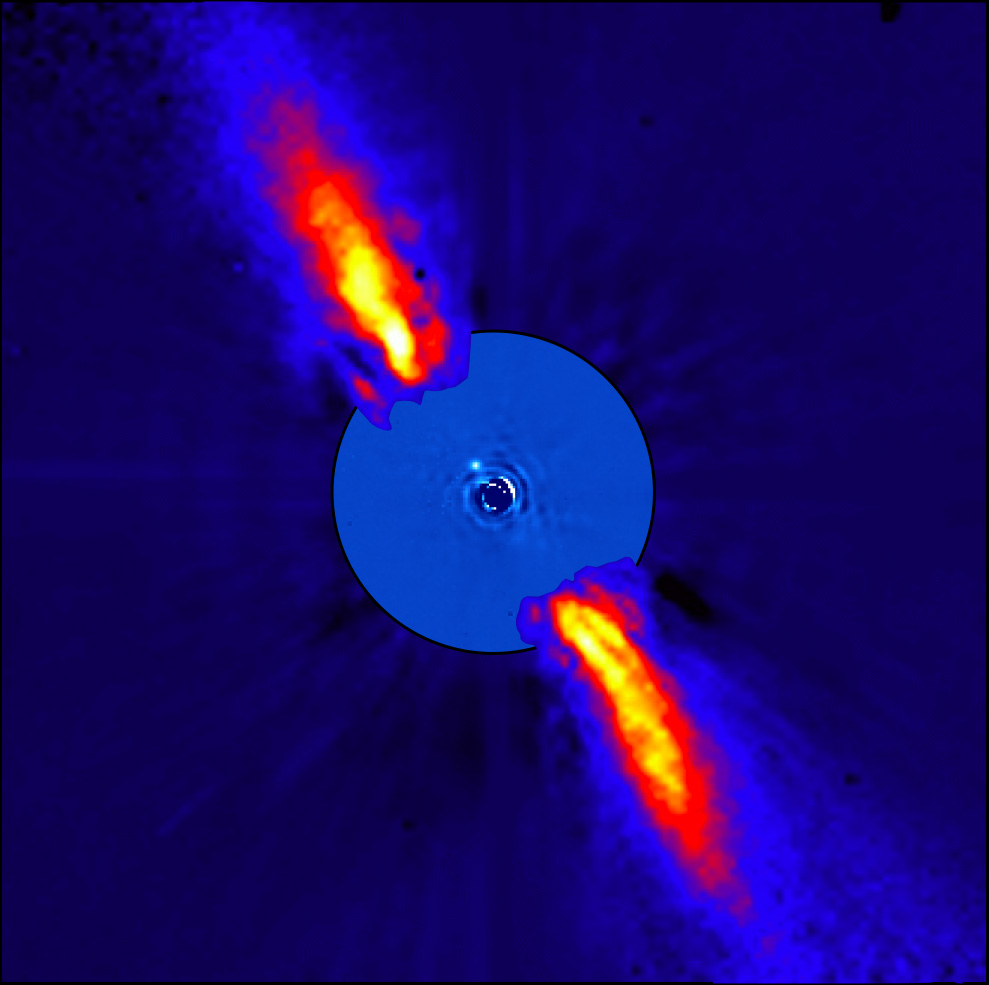
This study focuses on the directly imaged exoplanet β Pictoris b, a massive planet in a young planetary system that offers unique advantages for exomoon detection. With a mass of roughly 12 Jupiter masses, β Pictoris b exerts significant gravitational influence, making it more likely to host detectable moons. Furthermore, its edge-on orientation and proximity to Earth make it an ideal target for high-precision observational campaigns. These characteristics provide a compelling opportunity to refine techniques for detecting exomoons through the analysis of radial velocity variations.
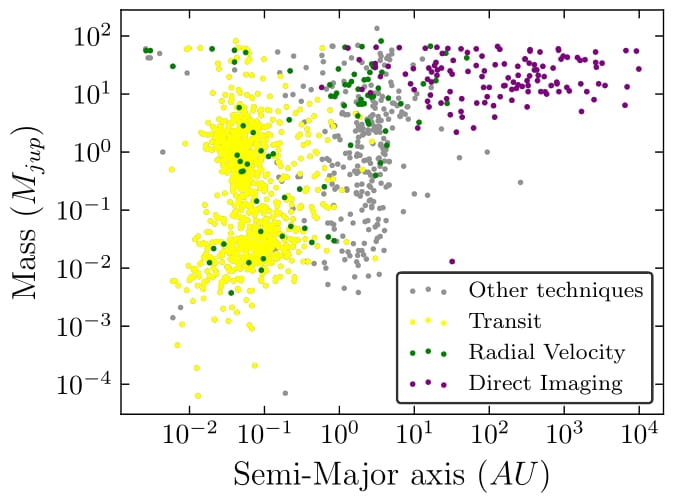
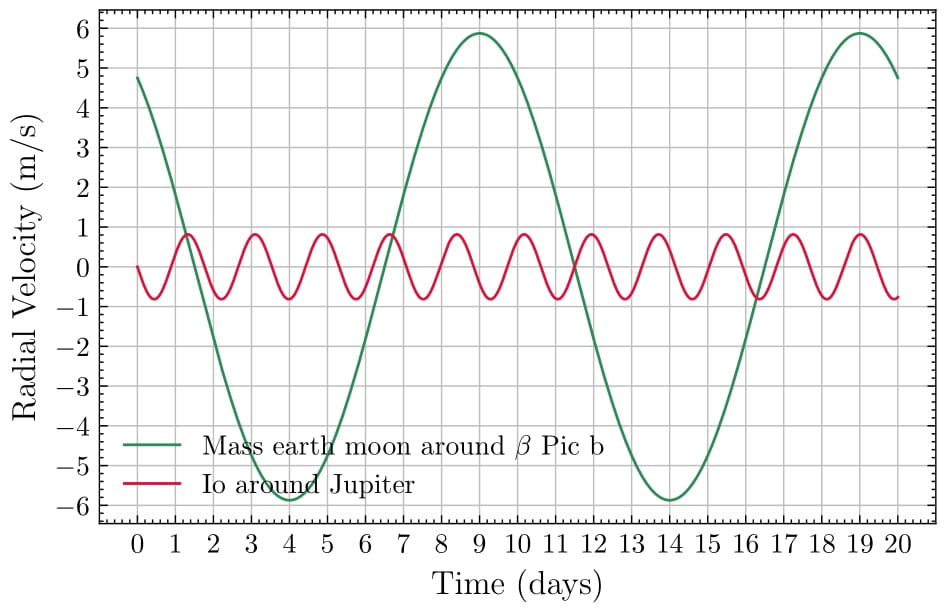
The figure below summarizes the key exoplanet detection techniques and highlights the radial velocity variations caused by moons. On the left, we see an overview of methods used to identify exoplanets. On the right, there is a comparison of the radial velocities of Jupiter and β Pictoris b, showing the effects of Io and a hypothetical Earth-mass exomoon with a 10-day orbital period. These simulations illustrate the potential signals that exomoons can induce in their host planets, guiding the design of detection strategies.
Radial Velocity Analysis
The radial velocity method has been successfully applied to the detection of exoplanets by measuring subtle Doppler shifts caused by a planet’s gravitational pull on its host star. Extending this method to detect exomoons is an exciting but challenging frontier. This chapter focuses on the induced radial velocity signals caused by potential moons orbiting the directly imaged exoplanet β Pictoris b, emphasizing how factors like moon mass and orbital period affect signal strength.
Using the exoplanet module, simulations were performed to explore the effect of moon mass and orbital period on the radial velocity signals. For reference, Io (one of Jupiter’s moons) was modeled to illustrate the dynamics of moon-induced radial velocity changes in a familiar system. This approach provided a comparative baseline against hypothetical Earth-mass exomoons orbiting β Pic b.
Key assumptions included circular orbits and an inclination of 90° (edge-on). This ensured consistency between scenarios while facilitating comparisons between the well-understood Jupiter-Io system and β Pic b.
Simulations generated radial velocity data across a grid of moon masses (0–80 Earth masses) and orbital periods (up to 100 days). The results were visualized using contour plots, highlighting the peak radial velocity as a function of these two variables. Noise thresholds of 500 m/s and lower were considered to determine detectability under current and near-future observational capabilities.
The comparison between Io and a hypothetical Earth-mass moon around β Pic b demonstrated the stark differences in induced radial velocities due to the vastly different planetary masses. While Io induces a peak velocity of approximately 0.815 m/s on Jupiter, an Earth-mass moon with a 10-day orbit induces a much larger signal of about 5.87 m/s on β Pic b. This difference underscores the advantages of targeting massive planets like β Pic b for exomoon searches.
The derived formula for estimating radial velocity amplitudes, based on the conservation of momentum and Kepler’s laws, aligns well with simulated data:
\begin{equation} v_{\text{planet}} = \left(\frac{2\pi G}{M^2 P}\right)^{\frac{1}{3}} \cdot m \end{equation}
For β Pic b, the formula confirmed that both moon mass and orbital period significantly influence radial velocity amplitudes. Larger and closer moons produce stronger signals, with longer orbital periods leading to diminishing amplitudes.
The contour plot below illustrates peak radial velocity as a function of moon mass and orbital period. The dotted line represents the detection threshold of 500 m/s, which corresponds to the capabilities of instruments like CRIRES+. Observational sensitivities for β Pic b, based on 25 simulated observations, are marked with blue crosses. Proposed exomoons around Kepler-1708 b-i and Kepler-1625 b-i are highlighted for context.

The results highlight β Pic b’s suitability for exomoon detection due to its mass and favorable orbital orientation. The findings also emphasize the importance of high-precision instruments for reducing noise and enhancing sensitivity. CRIRES+ and similar spectrographs hold significant potential for advancing this frontier.
By refining detection thresholds and observational strategies, this study lays the groundwork for uncovering exomoons in systems like β Pic b, marking a critical step toward characterizing these elusive companions.
Cross-Correlation of Spectra
Radial velocity measurements rely on detecting Doppler shifts in spectral lines caused by the motion of an exoplanet or its potential moon. In this chapter, we explore the process of simulating β Pictoris b’s spectrum, applying Doppler shifts, and extracting velocities using cross-correlation techniques. Two high-resolution spectra of β Pic b, provided by Dr. Tomas Stolker and Dr. Paul Mollière, serve as the basis for this analysis.
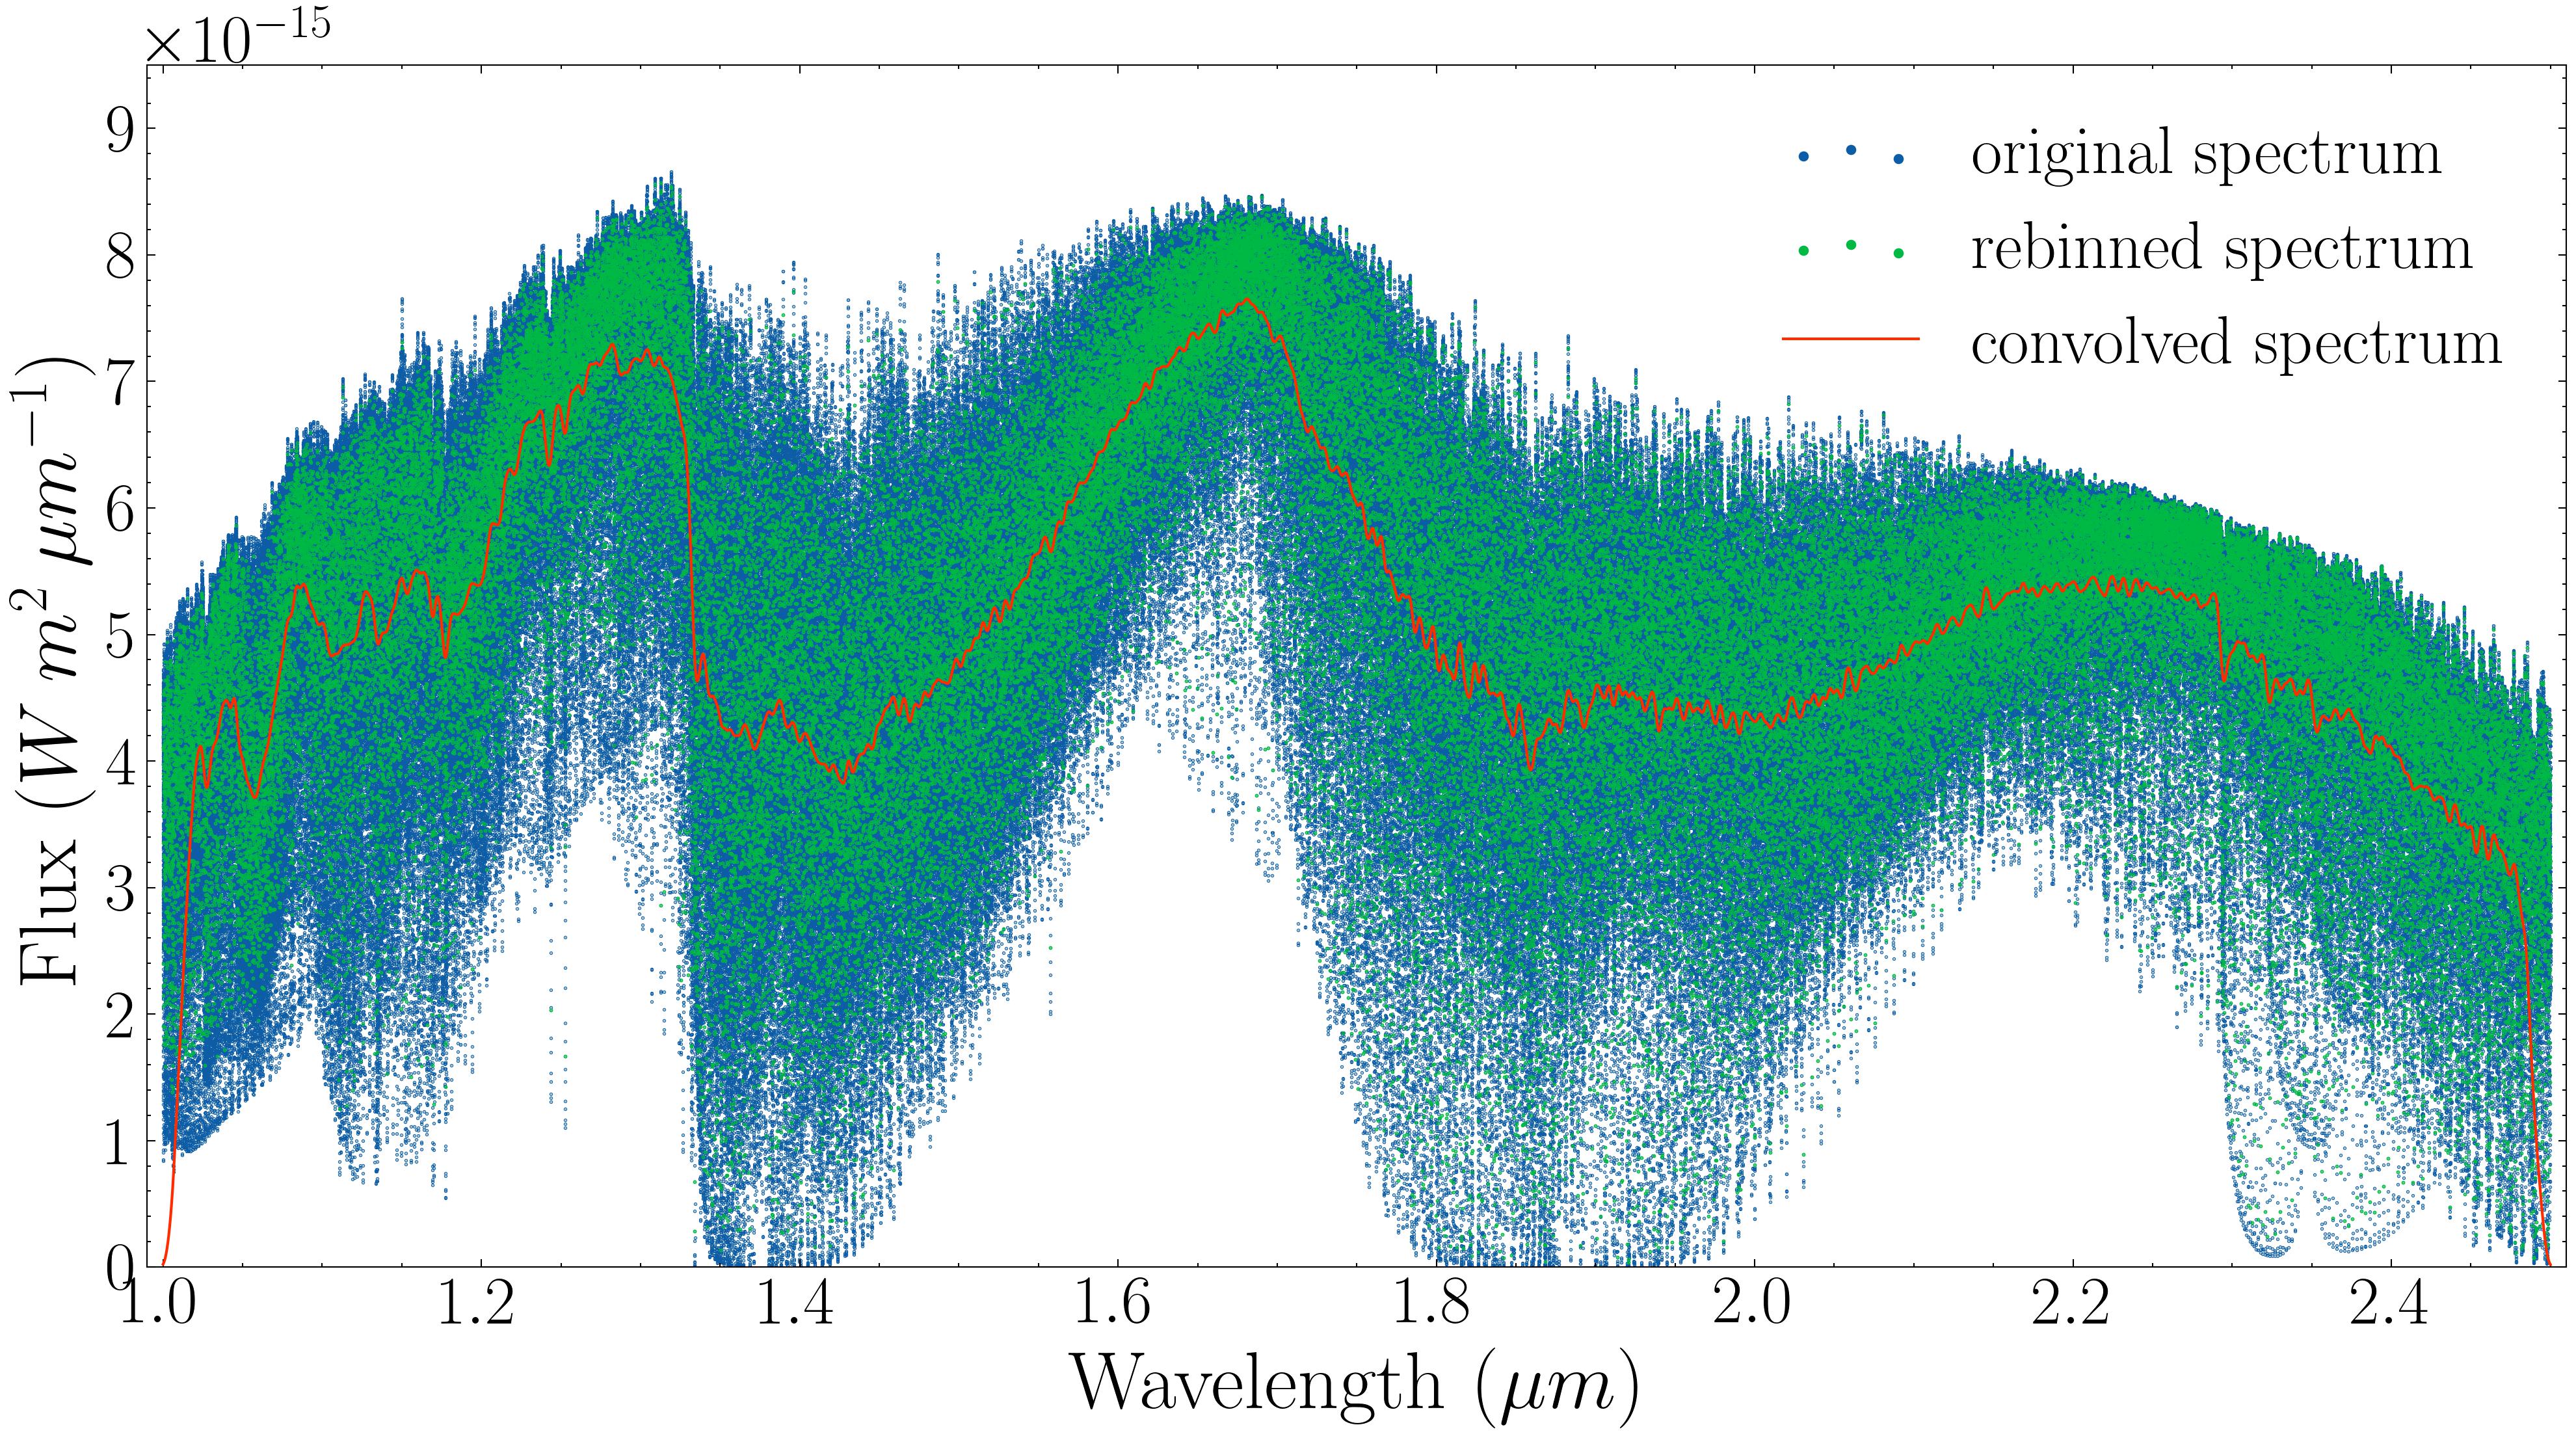
To analyze the spectra, the original high-resolution data were first rebinned into evenly spaced bins, each consisting of \(10^5\) data points, allowing for easier computational handling. This step retained key spectral features while simplifying the data. The rebinned spectra were then convolved with a normal distribution using a Tukey window, smoothing sharp edges and reducing noise. This process ensured that the spectra were suitable for cross-correlation analysis. The figure below illustrates the original, rebinned, and convolved spectra for both datasets.
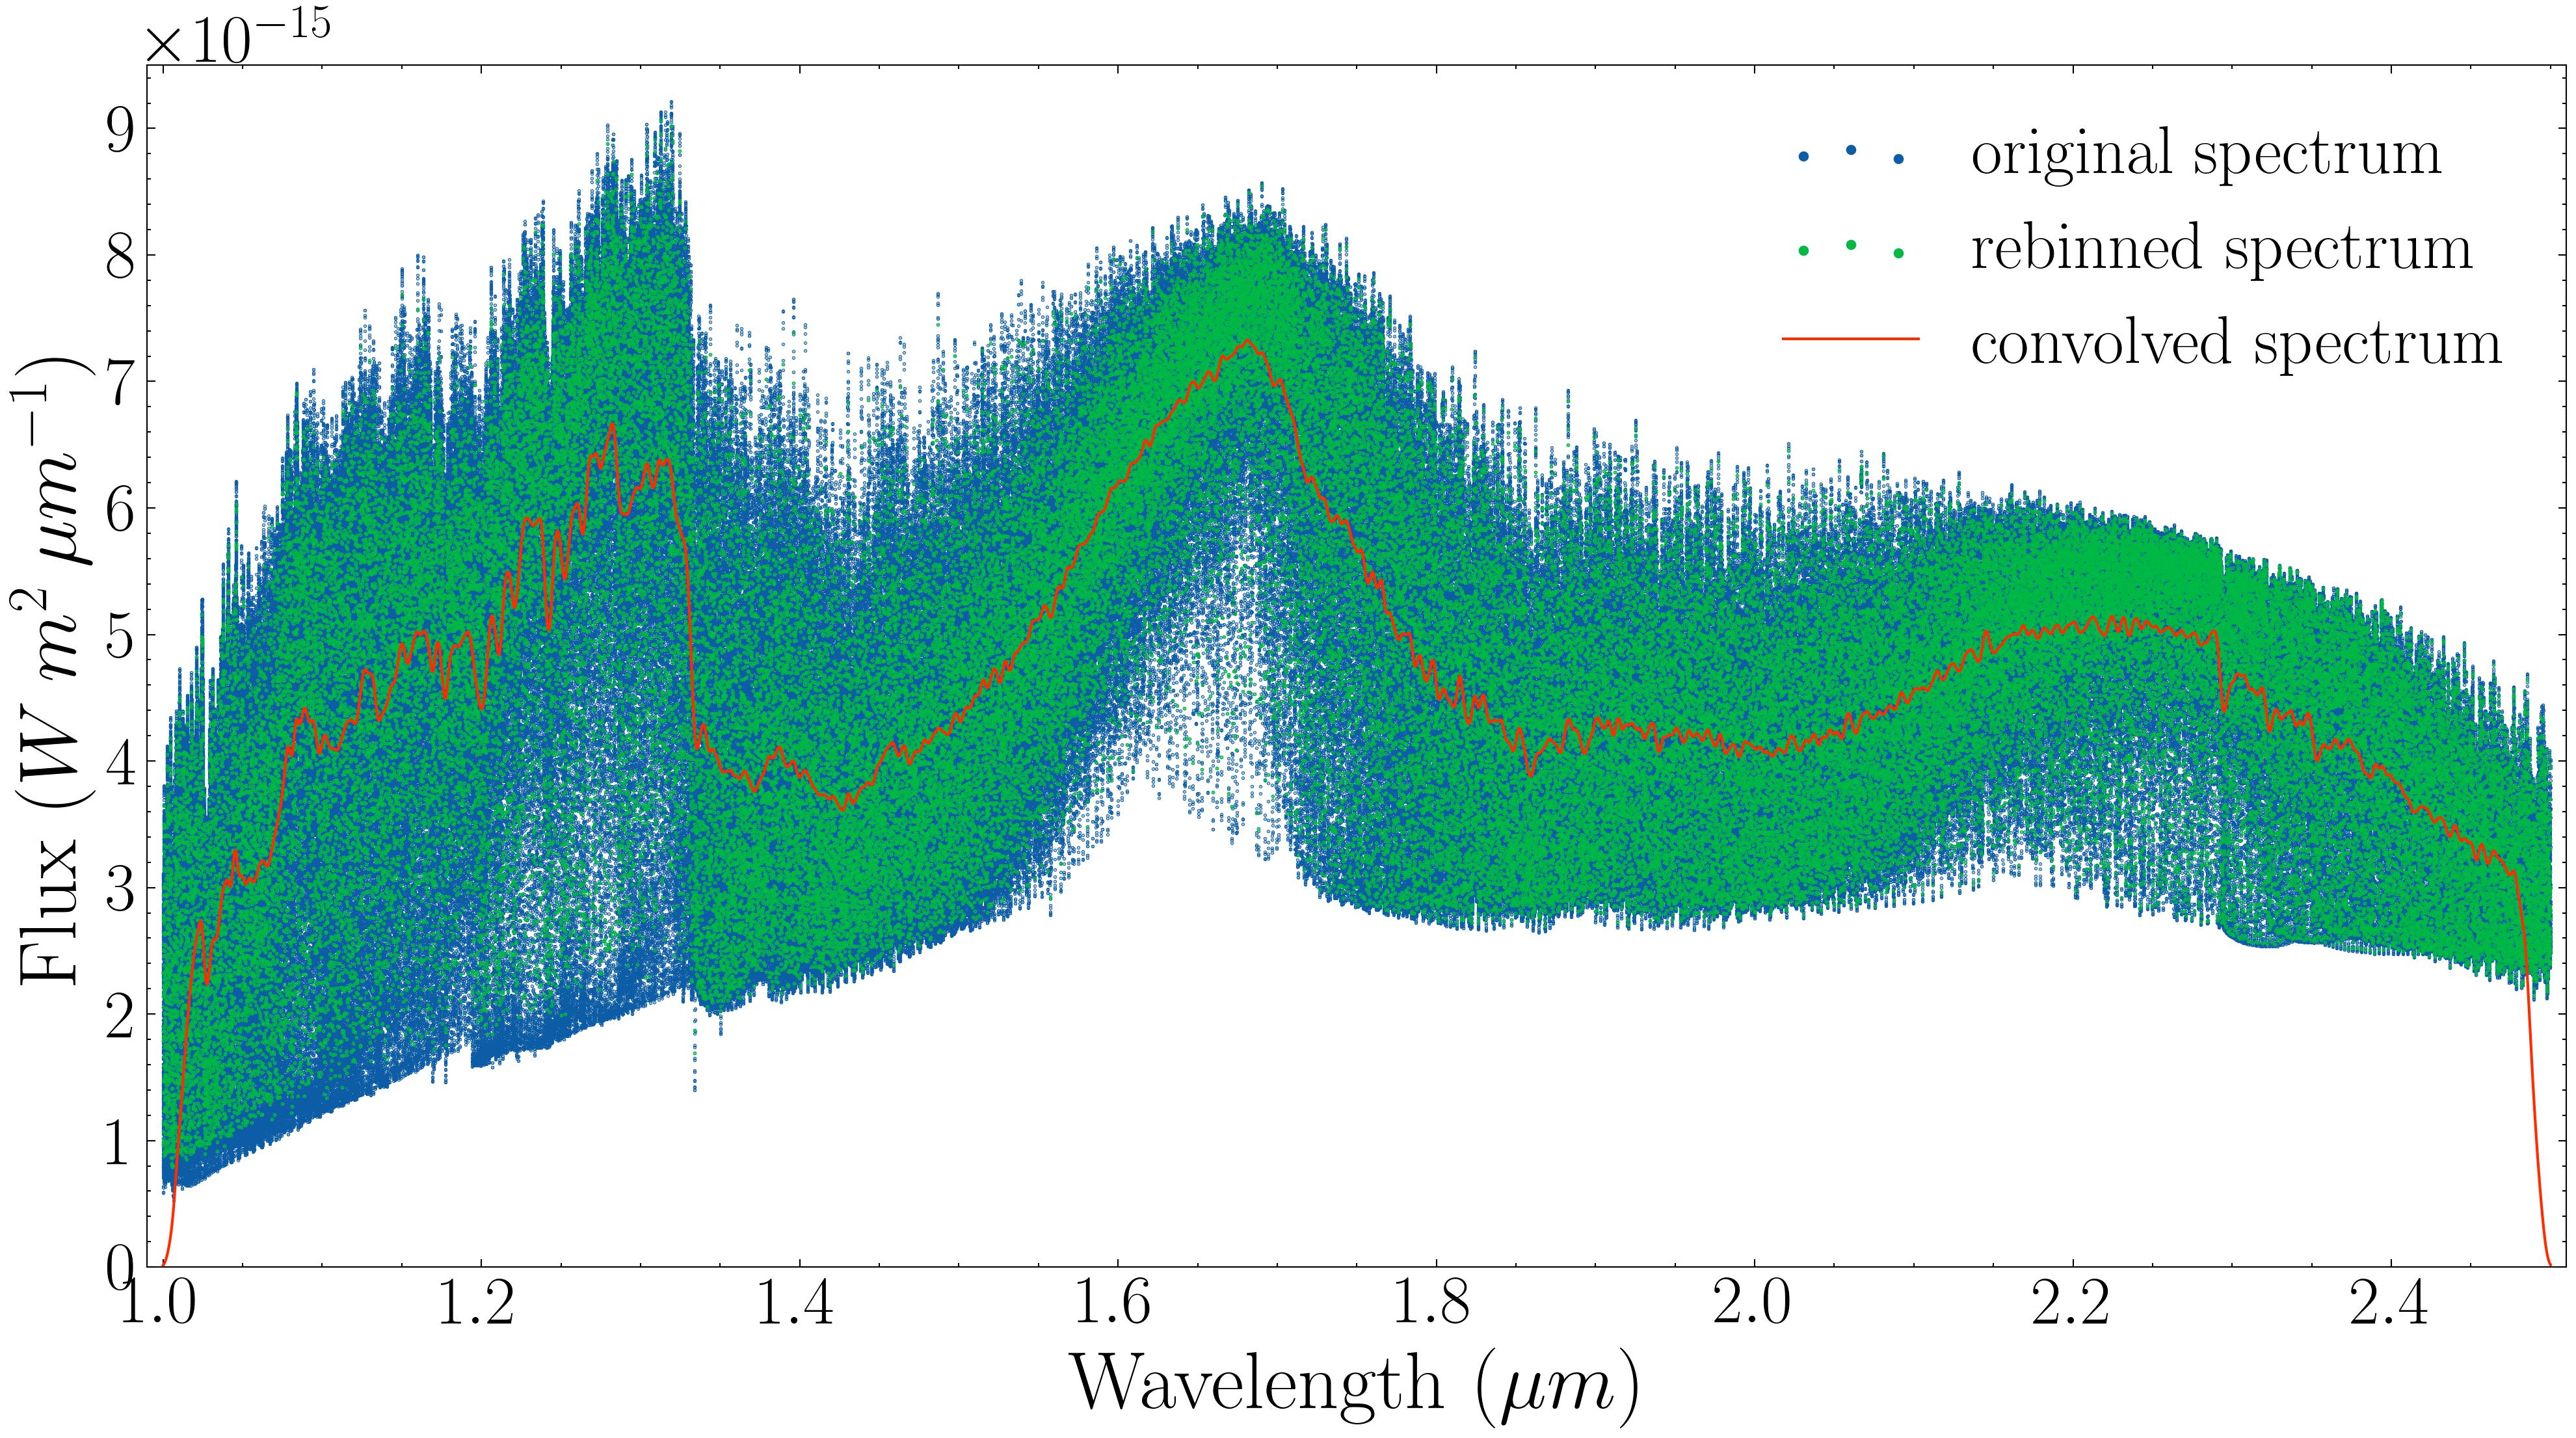
Next, the Doppler effect was simulated by shifting the convolved spectra by a known velocity (\(v = 3000 \, \text{km/s}\)) using a modified (for the purpose of this study) version of the pyasl.dopplerShift function from the PyAstronomy library. The shifted spectra were then cross-correlated with the original, allowing us to determine the applied velocity by identifying the peak of the cross-correlation function. The process demonstrated the method’s ability to accurately recover velocities within a small margin of error.
The non-relativistic Doppler effect was used in these calculations, defined as:
\begin{equation} z = \frac{\Delta \lambda}{\lambda} = \frac{v}{c}, \end{equation}
where \(v\) is the velocity of the object, \(c\) is the speed of light, and \(z\) represents the fractional shift in spectral lines.
The results of the convolution and Doppler-shift processes are illustrated below. Figures on the left panels show the convolved spectra in green and the Doppler-shifted spectra in red, while the right panels show the cross-correlation outputs. The peak of the cross-correlation closely matches the velocity used to shift the spectra (\(v = 3.0 \times 10^6 \, \text{m/s}\)).
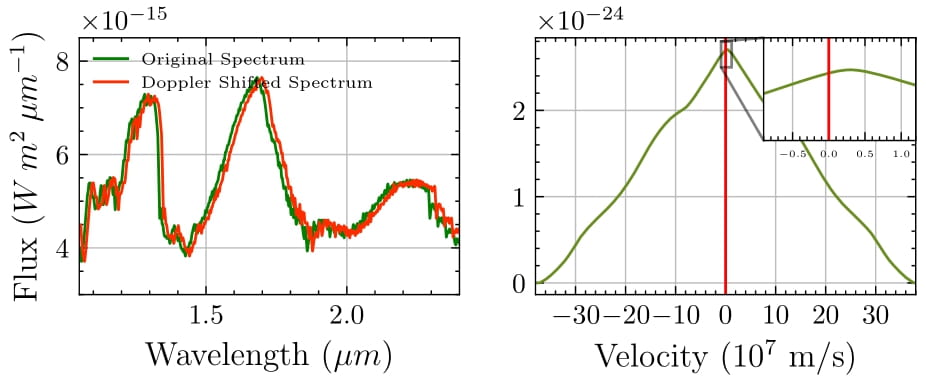
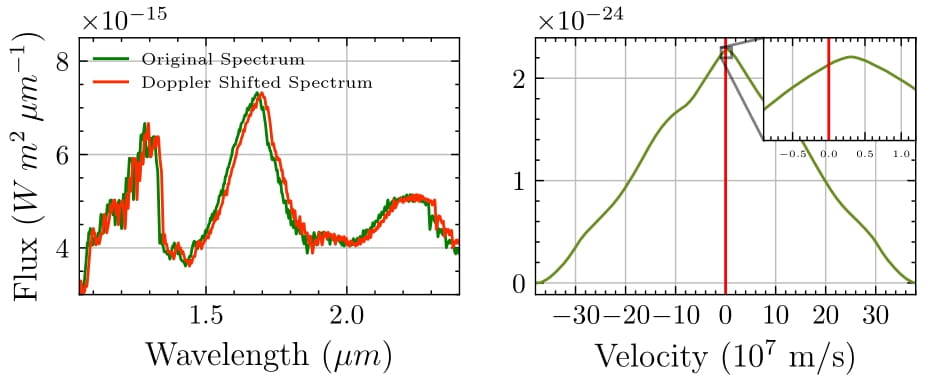
The following table summarizes the measured velocities and their deviations from the true Doppler shift:
| Spectrum Provider | Measured Velocity (\(10^6 \, \text{m/s}\)) | True Velocity (\(10^6 \, \text{m/s}\)) |
|---|---|---|
| Dr. Tomas Stolker | \(3.009 \pm 0.004\) | 3.000 |
| Dr. Paul Mollière | \(3.073 \pm 0.004\) | 3.000 |
These results confirm the effectiveness of cross-correlation in accurately determining radial velocities with minimal error and validates the feasibility of extracting radial velocity data using high-resolution spectra, a critical step toward detecting exomoon-induced shifts. The ability to measure velocities with such precision opens the door for further exploration of smaller perturbations caused by potential exomoons.
By integrating these methods with observational data, future studies can improve the accuracy and sensitivity of exomoon detection techniques, enabling a more comprehensive understanding of planetary systems like β Pictoris b.
Simulating Exomoon Detection
Through Bayesian modeling, this chapter simulates the detection of exomoons by creating synthetic radial velocity data with added observational noise. The study focuses on β Pictoris b, a massive exoplanet with favorable characteristics for exomoon detection. By varying moon masses, orbital periods, and noise levels, we investigate the detectability thresholds for exomoons around β Pic b, providing insights into the challenges and opportunities of exomoon detection through radial velocity analysis.
To simulate exomoon signals, we use the exoplanet module, setting β Pictoris b as the central body with known parameters such as mass (\(11.9 M_{\text{J}}\)) and radius (\(1.65 R_{\text{J}}\)). Orbital inclinations are fixed at \(90^\circ\) to simulate edge-on orbits, and we assume circular orbits for simplicity.
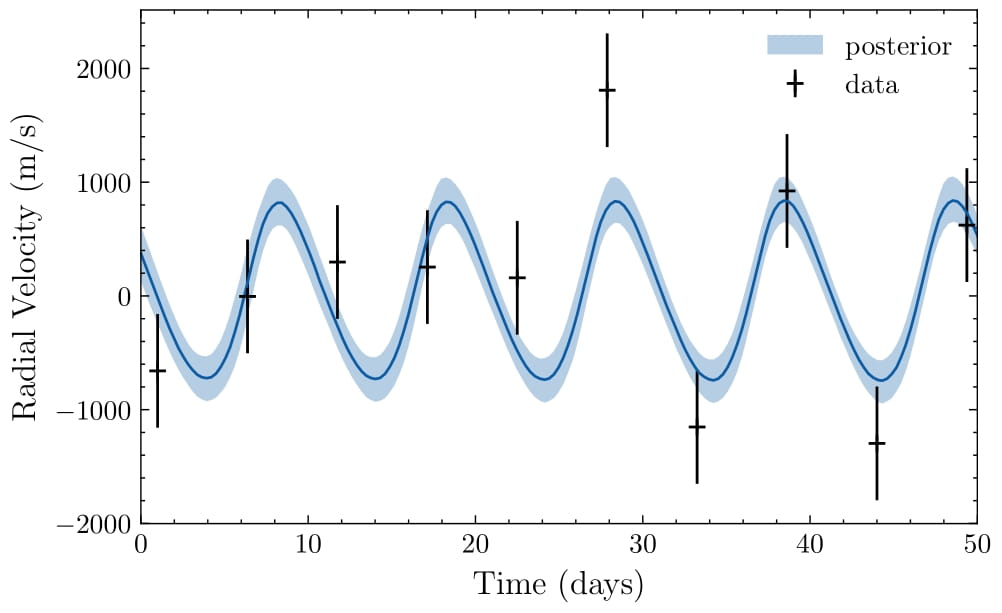
Synthetic radial velocity data is generated for 25 observations spanning 130 days, consistent with observing schedules from the VLT’s CRIRES+ spectrograph. To mimic real conditions, observational noise is added, modeled as a Gaussian distribution with amplitudes of 500 m/s (current capabilities) and 250 m/s (near-future improvements).
We apply a Bayesian model using PyMC3 to fit orbital parameters, including the moon’s period and semi-amplitude. The model uses Markov Chain Monte Carlo (MCMC) sampling, with 1000 tuning iterations and 1000 draws per chain. Successful detections occur when the model converges, producing well-constrained posteriors for key parameters.
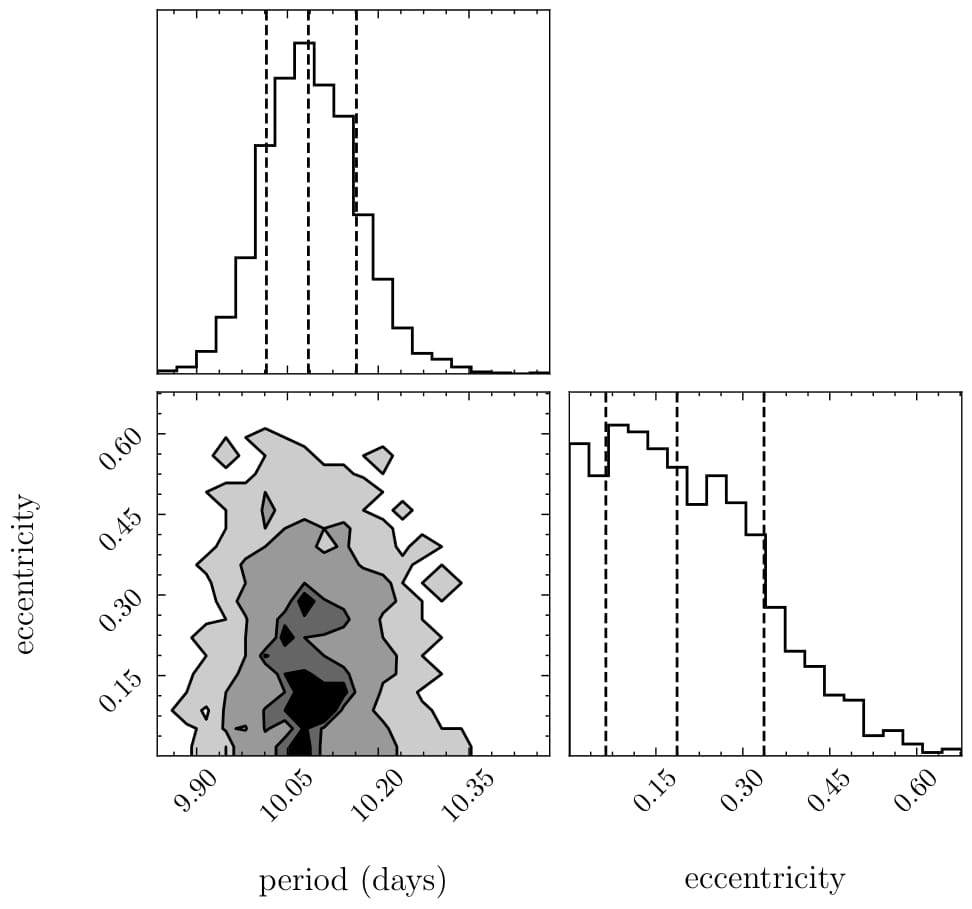
In the figure below, we simulate a moon with 80 Earth masses and a 10-day orbital period. Despite 500 m/s noise, the Bayesian model fits the radial velocity data well, converging on a posterior period of the same value, within the confidence interval. The model’s accuracy demonstrates that such moons are detectable with current observational noise thresholds.
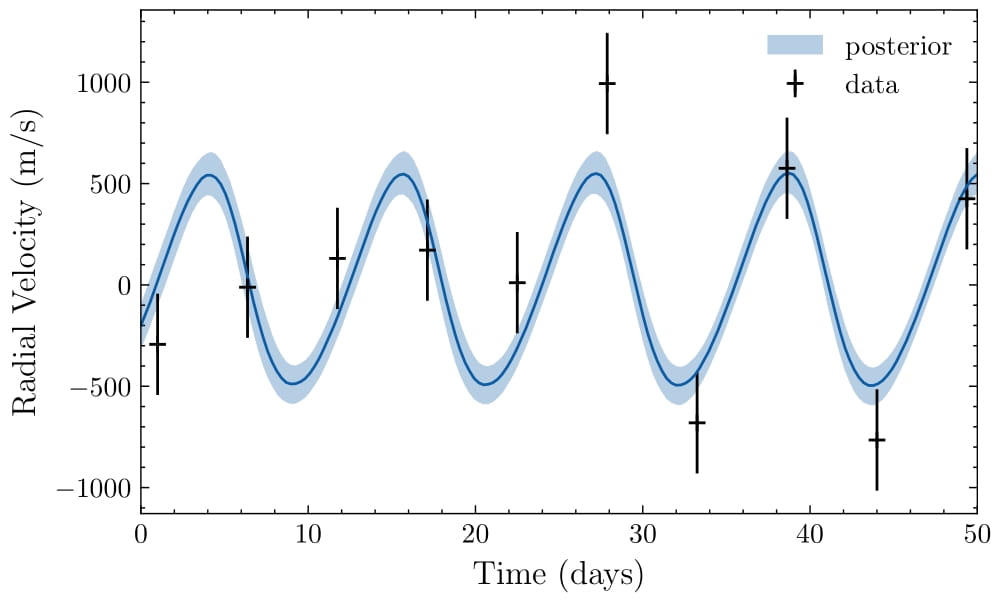
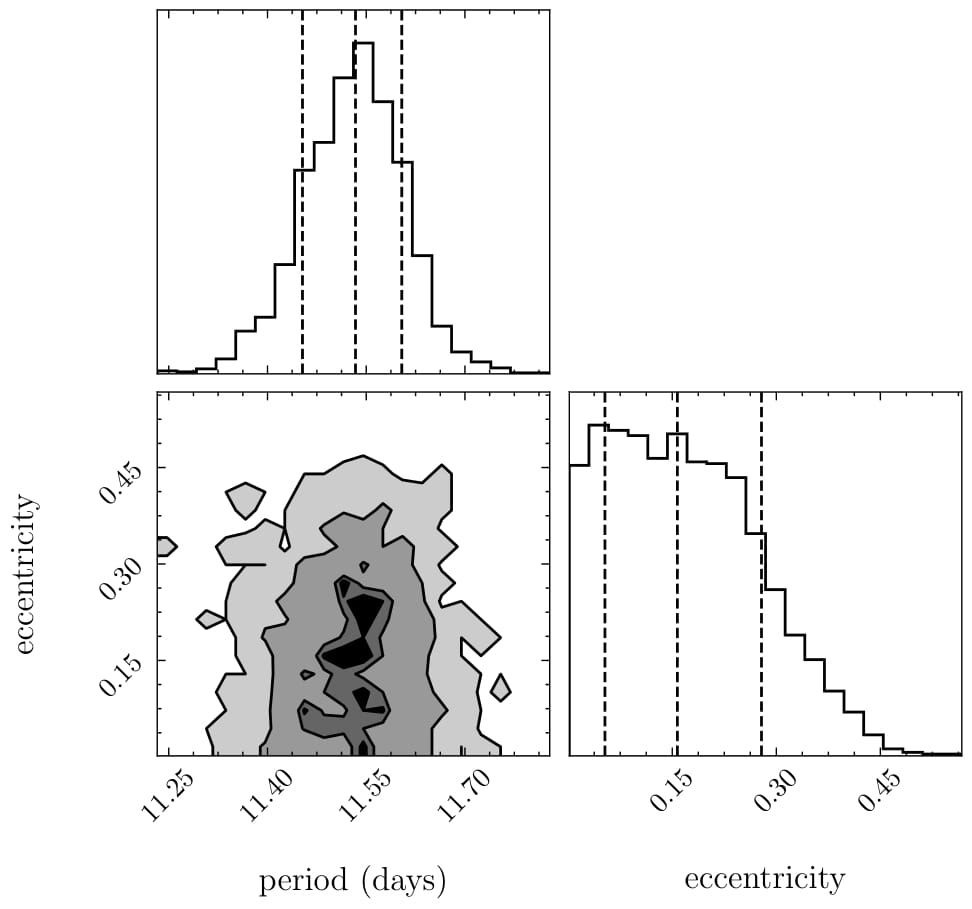
In the next figure we simulate a moon with 60 Earth masses and the same orbital period but with reduced noise (250 m/s). The Bayesian model is able to detect the moon, although the period is not as well constrained as in the previous case. It is important to note that the reduced noise allowed for a detection that would not be possible with the higher noise level. Reduced noise significantly improves detection capabilities, even for smaller moons, highlighting the value of technological advancements.
The table below summarizes the minimum detectable moon masses for different orbital periods and noise levels, highlighting the impact of these factors on exomoon detectability. Shorter periods and lower noise levels significantly enhance detection capabilities, allowing for the identification of smaller moons around β Pic b.
| Orbital Period (days) | Observational Noise (m/s) | Minimum Detectable Moon Mass (Earth Masses) |
|---|---|---|
| 10 | 250 | 20 |
| 10 | 500 | 40 |
| 20 | 250 | 60 |
| 20 | 500 | 130 |
The study demonstrates that moons with higher masses and shorter orbital periods are easier to detect. With current noise levels (500 m/s), only moons above 40 Earth masses with 10-day periods are detectable. However, reducing noise to 250 m/s lowers this threshold to 20 Earth masses. For longer periods (20 days), the minimum detectable mass increases, showing that orbital characteristics significantly impact detectability. These findings emphasize the importance of high-precision instruments like CRIRES+ in advancing exomoon detection capabilities.
Real Data and Surface Spots
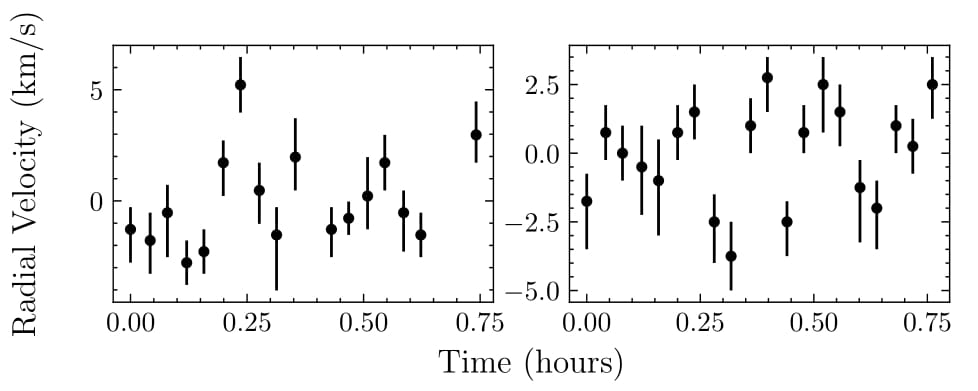
This chapter focuses on explaining the peculiar radial velocity (RV) data observed for β Pictoris b, using CRIRES+ spectrograph data collected during two one-hour observational runs on November 11 and November 13, 2022. The observed variations in radial velocity are hypothesized to result from the Rossiter-McLaughlin effect caused by atmospheric spots on the planet’s surface, rather than the presence of an orbiting body.
The RV data were provided by Dr. Rico Landman and reduced using the pycrires pipeline combined with the official esorex pipeline. Each dataset corresponds to 17 and 20 data points for the respective runs. These data show rapid fluctuations over short time periods, which cannot be explained by planetary orbital mechanics alone.
The starry package was utilized to model the effects of surface spots on the RV signal. Spherical harmonic coefficients were used to represent the planet’s surface. The model simulated spots by varying parameters such as size, latitude, and number, while the planet’s rotational velocity was fixed. In a test example, six spots were placed along the equator of β Pictoris b. Limitations in the package restricted the maximum number of spots to 11 and the minimum spot radius to 15 degrees.
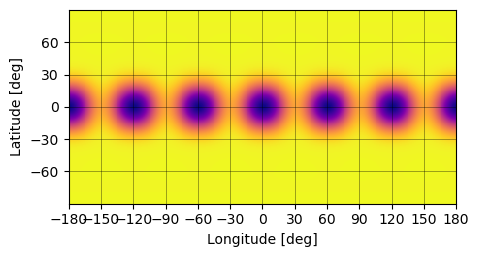
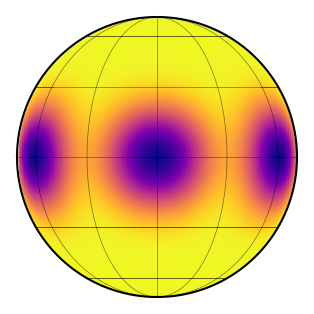
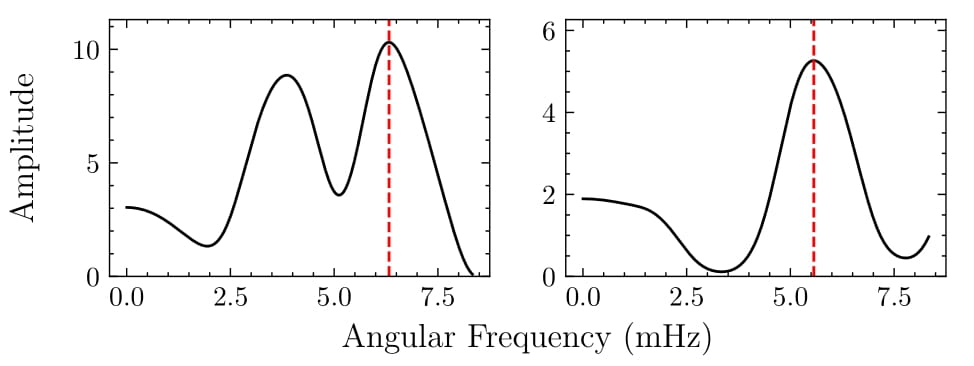
Fourier transforms of the RV time series revealed a primary frequency peak around 5.5 mHz for both observational runs. A sinusoidal model was then fitted to the time series to extract the angular frequency and amplitude of the signal.
Using the starry package, simulations demonstrated that the number of spots on the surface directly impacts the periodicity of the RV signal. Latitude had no significant effect on the period. By extrapolating the simulated data, the number of spots required to produce the observed RV signal periods was estimated.
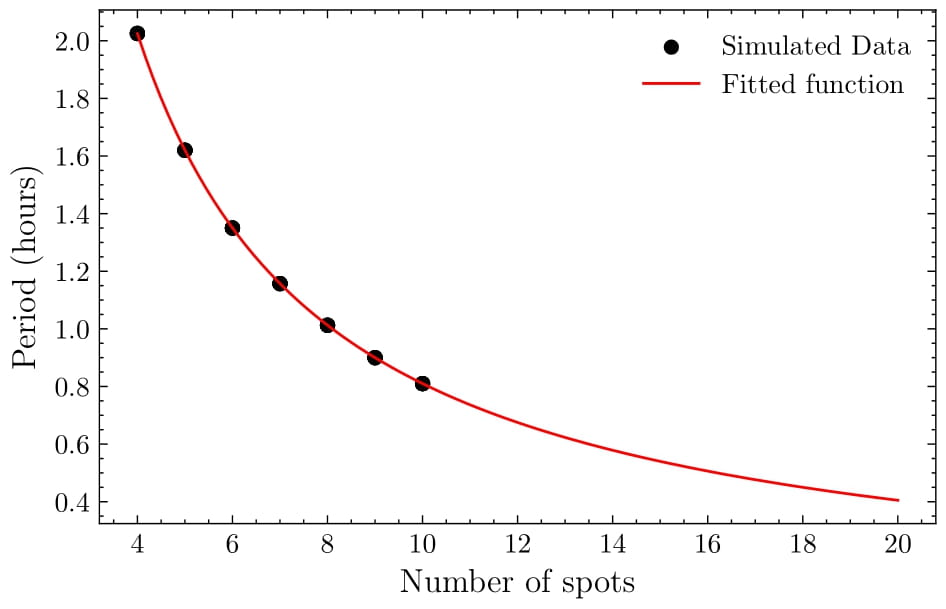
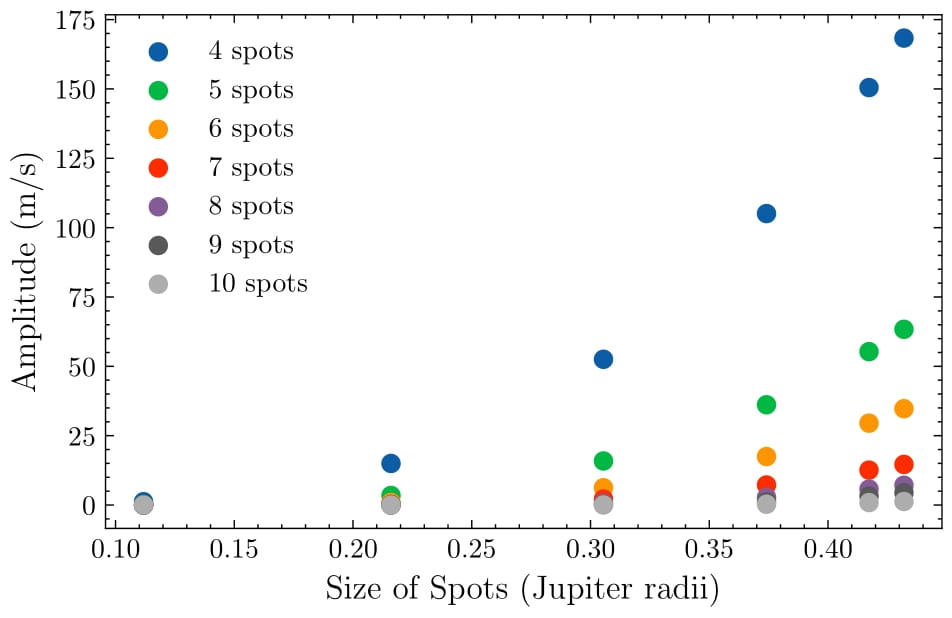
The table below summarizes the results of the simulations, showing the mean period of each run and the range of spot numbers that could explain the observed RV fluctuations. The analysis suggests that atmospheric spots could account for the observed RV variations in β Pictoris b, with spot size and number influencing the RV amplitude. Further simulations using advanced tools are needed to refine these results and explore the full range of possibilities.
| Mean Period (days) | Number of Spots | |
|---|---|---|
| Run 1 | \(0.271 \pm 0.025\) | 27-33 |
| Run 2 | \(0.345 \pm 0.050\) | 21-27 |
The analysis supports the hypothesis that atmospheric spots, can explain the observed radial velocity fluctuations in β Pictoris b. While spot size and number influence the RV amplitude, additional simulations with advanced tools are required to refine these results. The work demonstrates that spots could explain RV fluctuations on scales consistent with those observed in β Pictoris b.
Conclusions and Future Work
Detecting exomoons via radial velocity techniques represents a frontier in astronomical research, pushing the limits of current observational technologies. This thesis has focused extensively on β Pictoris b, leveraging its nearly edge-on orbit and high mass, which make it an optimal candidate for such studies.
Key findings include:
-
Radial Velocity Simulations:
- The detectability of exomoons depends significantly on their mass and orbital period.
- Shorter orbital periods and higher masses produce stronger radial velocity signals.
- Detection thresholds were established for two noise levels:
- At 500 m/s noise: moons >40 Earth masses with 10-day orbital periods are detectable.
- At 250 m/s noise: moons >20 Earth masses with 10-day orbital periods are detectable.
-
Cross-Correlation Analysis:
- Simulated spectra of β Pictoris b validated the cross-correlation technique for extracting Doppler shifts.
- This method proved robust even under noisy conditions, emphasizing its utility for radial velocity studies.
-
Surface Spots as a Contaminant:
- Real data from CRIRES+ revealed rapid radial velocity variations likely caused by atmospheric spots.
- These findings highlighted the importance of accounting for planetary atmospheric phenomena to avoid misinterpreting noise as exomoon signals.
Building on these findings, several avenues for future research emerge:
-
Extended Observational Campaigns: Increasing the number and duration of radial velocity observations for β Pictoris b would improve sensitivity to smaller moons and longer orbital periods. Observations should ideally be spaced to capture multiple orbital cycles, reducing ambiguities in signal interpretation.
-
Advances in Instrumentation: Future spectrographs with higher resolution and lower noise floors could significantly enhance the detectability of exomoons. Next-generation facilities could be pivotal in overcoming current technological limitations.
-
Refined Models for Noise and Contaminants: Expanding simulations to include more complex atmospheric phenomena (e.g., differential rotation zones, turbulence) could help disentangle exomoon-induced signals from planetary noise. Machine learning models may also assist in identifying subtle periodic signals buried in observational data.
-
Application to Other Systems: While β Pictoris b is an ideal testbed, applying the techniques developed in this study to other high-mass, edge-on exoplanets could broaden the scope of exomoon detection efforts.
-
Integration of Complementary Techniques: Combining radial velocity methods with other detection techniques, such as transit timing variations, could provide corroborative evidence for exomoons and enhance detection confidence.
In conclusion, while the detection of exomoons remains a formidable challenge, this study lays critical groundwork for future explorations. By refining existing methodologies and leveraging advances in observational technology, the dream of detecting and characterizing exomoons may soon become a reality.
Acknowledgments
This work was conducted under the supervision of Prof. Matthew Kenworthy at Leiden Observatory. Special thanks to Dr. Rico Landmann, Dr. Tomas Stolker, and Dr. Paul Mollière for their invaluable contributions.